Analytics across time periods and more reporting improvements

An important pillar in every FinOps practice is visibility of cost, but also carbon, technology and how to optimize to improve on business value. Reporting on change (or progress) is a critical aspect to understand whether your organization is on the right track.
We now added the "Time Range Comparison" report in Txture version 47. This report allows you to leverage Txture's revision-aware data to historically aggregate and compare, for instance, cost or carbon emissions across different time periods (see Figure 1).
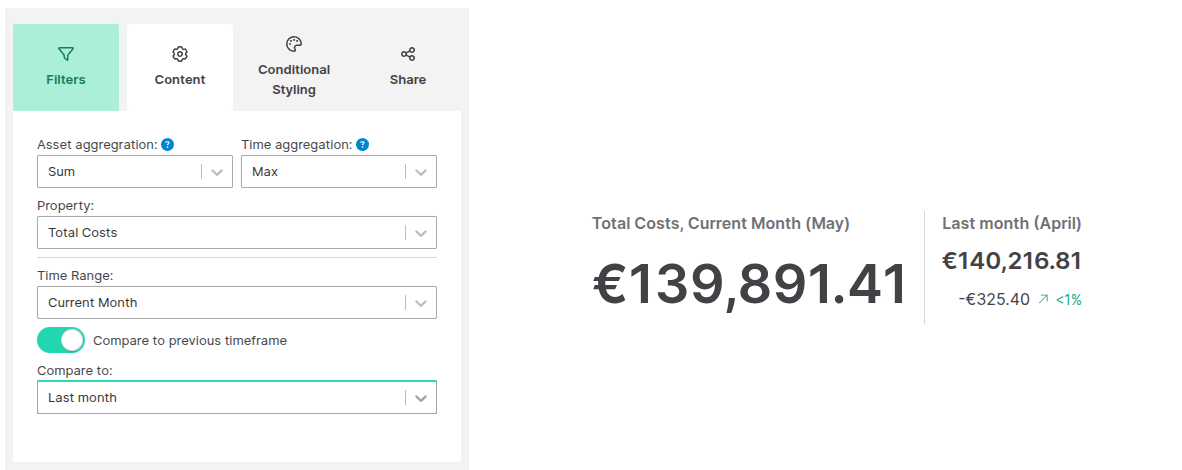 Figure 1. Comparison of monthly cost summarized across the IT and cloud estate. Left is the configuration of the report and the right side shows the report itself, as it can be used e.g. in custom dashboards.
Beyond the new Time Range Report, we worked on improving the overall reports management in Txture, but also the individual configuration UI per report type.
Figures 2 and 3 show the new reports overview and management area which allows for easy search and access of all your own and shared reports. Additionally the "Templates" section offers a quick way to create a predefined parameterized report. We ship preconfigured templates e.g. to resolve an applications' deployment stack for a selected application, but you can also add your own template reports easily.
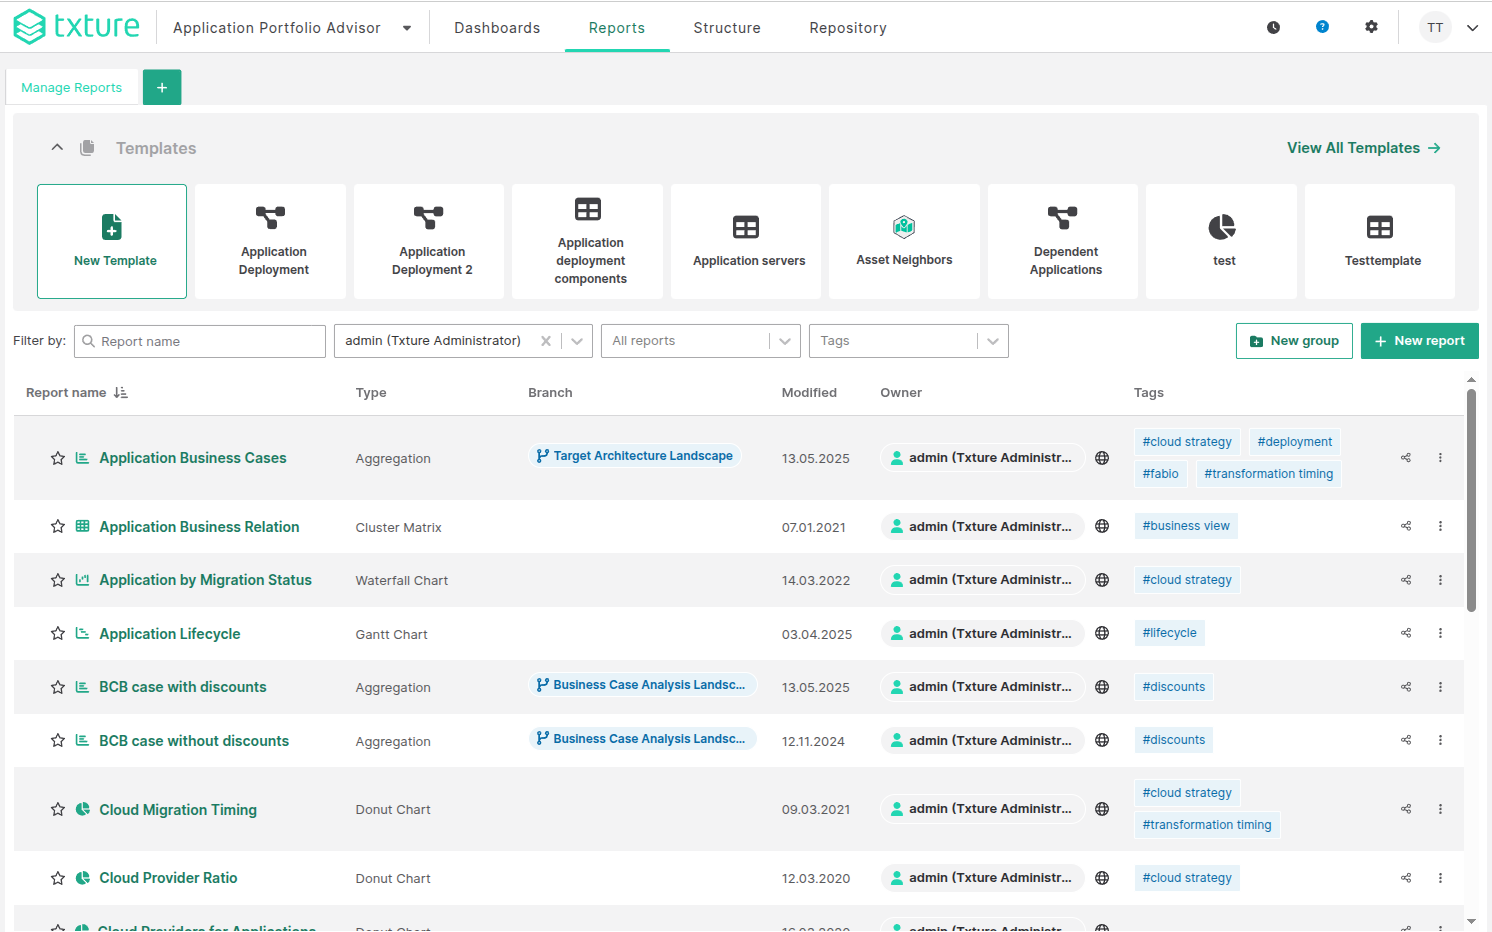 Figure 2. New and improved report overview and management area, also showing the quick access section for template reports.
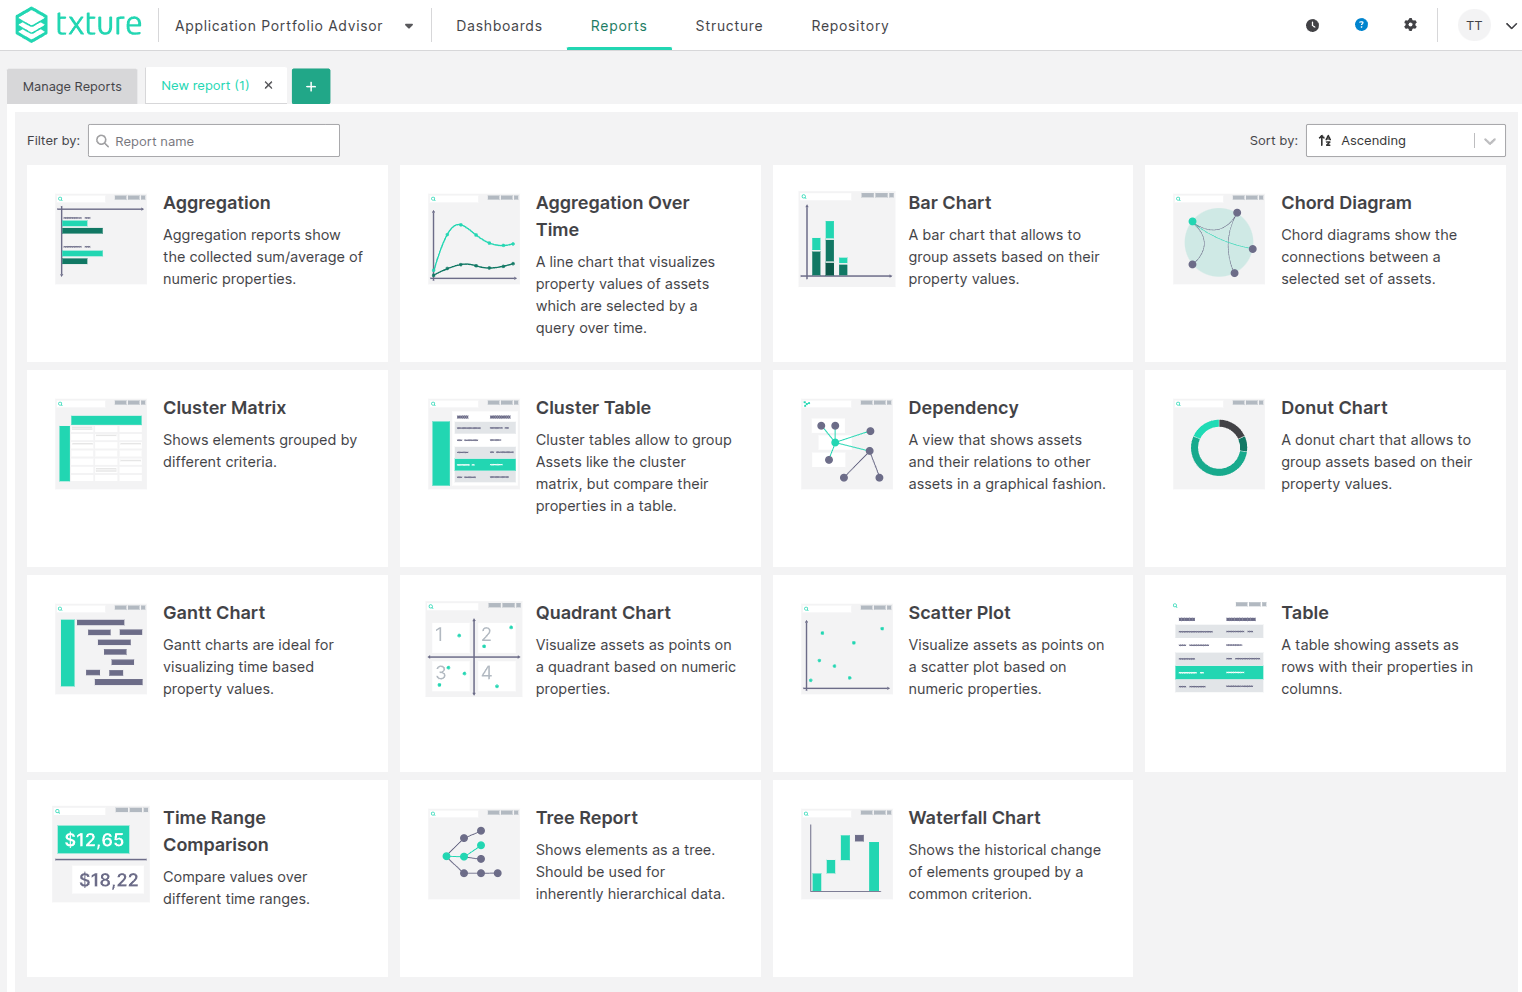 Figure 3. Improved area for creating new reports based on a particular report type. This can also be used to create template reports.
Figure 4. takes the example of a bar chart in Txture and shows the new configuration layout in the left sidebar, consistently across all report types offering the following sections:
- Filters, allowing you to add and modify the underlying query the report is for (e.g. all Virtual Servers driving applications of a particular business unit)
- Content, offering settings specific to report types to steer the visualization of data
- Conditional Styling, providing means to highlight particular data items based on data conditions
- Share, to configure accessibility of reports, get links to share or embed a report
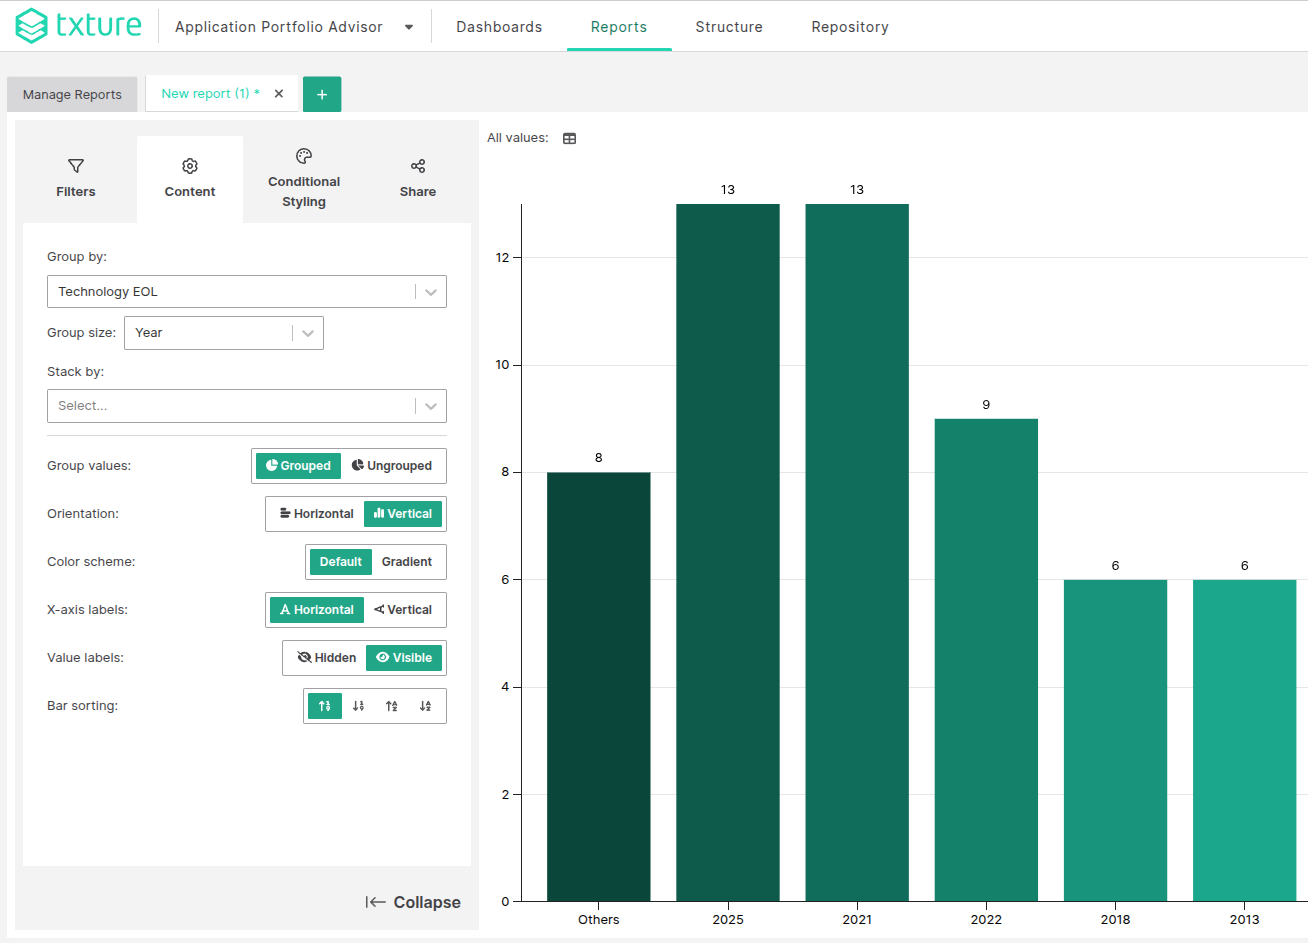 Figure 4. An example report showing the new left sidebar with unified configuration options across all report types.
Your feedback to our new feature
Want to learn more about the Txture platform? Reach out to us, we'll be happy to help!