FinOps with Txture - Understanding and optimizing cloud cost, carbon footprint and architecture

Optimizing cloud-related costs within an organization begins with a clear understanding of the current situation.
- What are our cloud expenses, and what do they correspond to?
- How are these costs distributed across various applications, projects, and organizational units?
The next step is to share cloud cost insights with the relevant departments through clear, concise, and real-time information. This empowers each team to take ownership of their cloud expenses and to determine the actions needed to start optimizing their costs.
As part of our new release, we're excited to announce new features that will enable organizations, whatever their size and resources, to quickly develop a real-time visibility of their cloud costs and find the best ways to optimize their cloud infrastructure.
Automated ingestion of cloud cost and usage data
Txture now supports the ingestion of cost and usage data of AWS, Google Cloud and Azure estates according to the FinOps Open Cost and Usage Specification (FOCUS™).
This goes hand in hand with our pre-existing data collection capabilities of cloud resources and dependency mapping to make transparent how they drive business applications in your organization.
Our approach has always been business application-centric. We strongly believe that optimization and modernization in (or towards) cloud rely on a proper understanding of each application and its role and value for the business.
Cloud cost allocation and distribution
As a feature addition, we now support the distribution and (weighted) allocation of cost and carbon emissions of standalone and shared components, in application deployment stacks and the business architecture.
This leads to key insights around attributable CAPEX, (cloud) runtime cost, operating cost, license cost, etc. per business application, per supported business capability or owning business unit (see examples in Figure 1 to 3).
In the same fashion we support these insights for carbon emission footprint analyses.
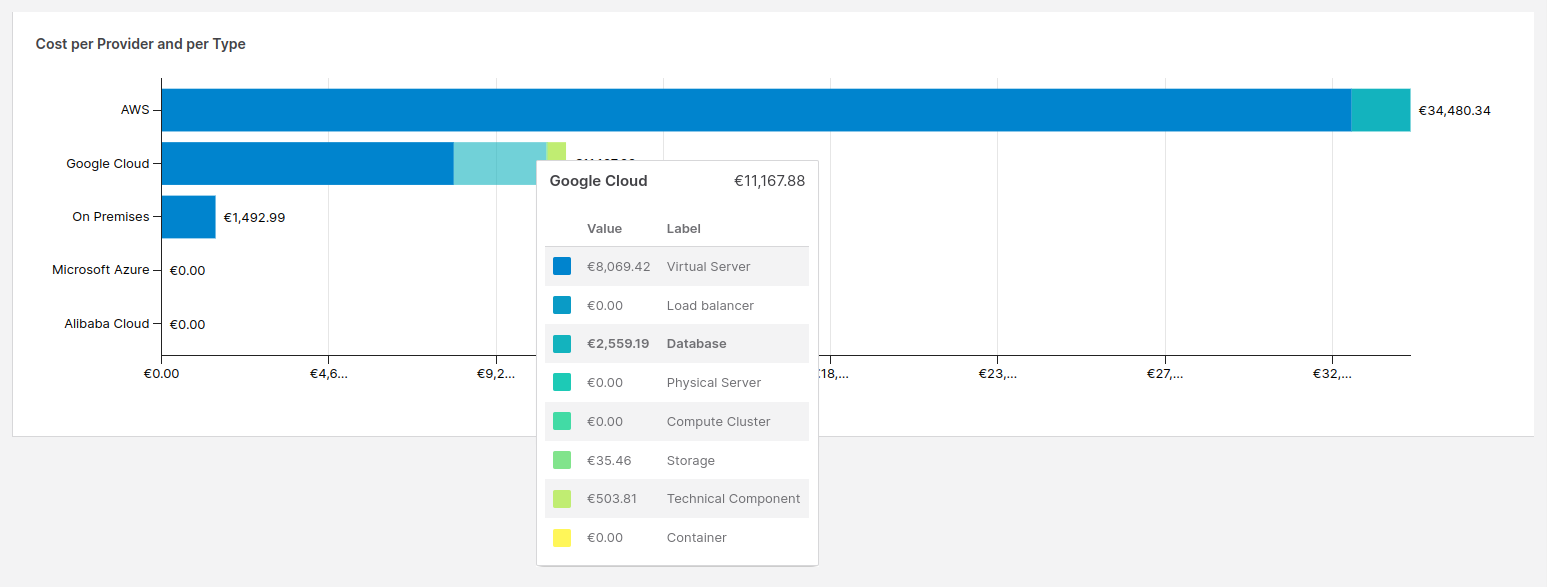 Figure 1. Cloud OPEX per technology type and cloud service provider
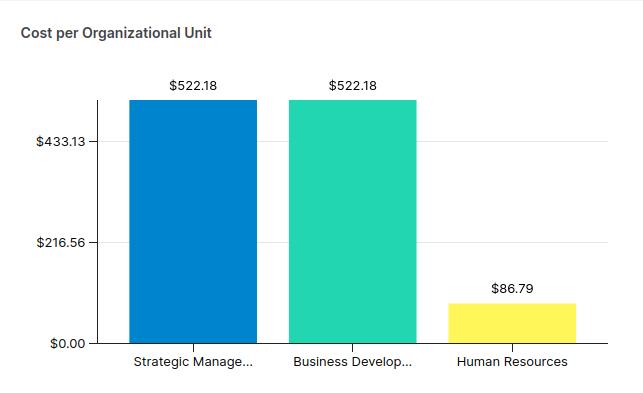 Figure 2. Weighted cost allocation of an application as it is used/owned by business units.
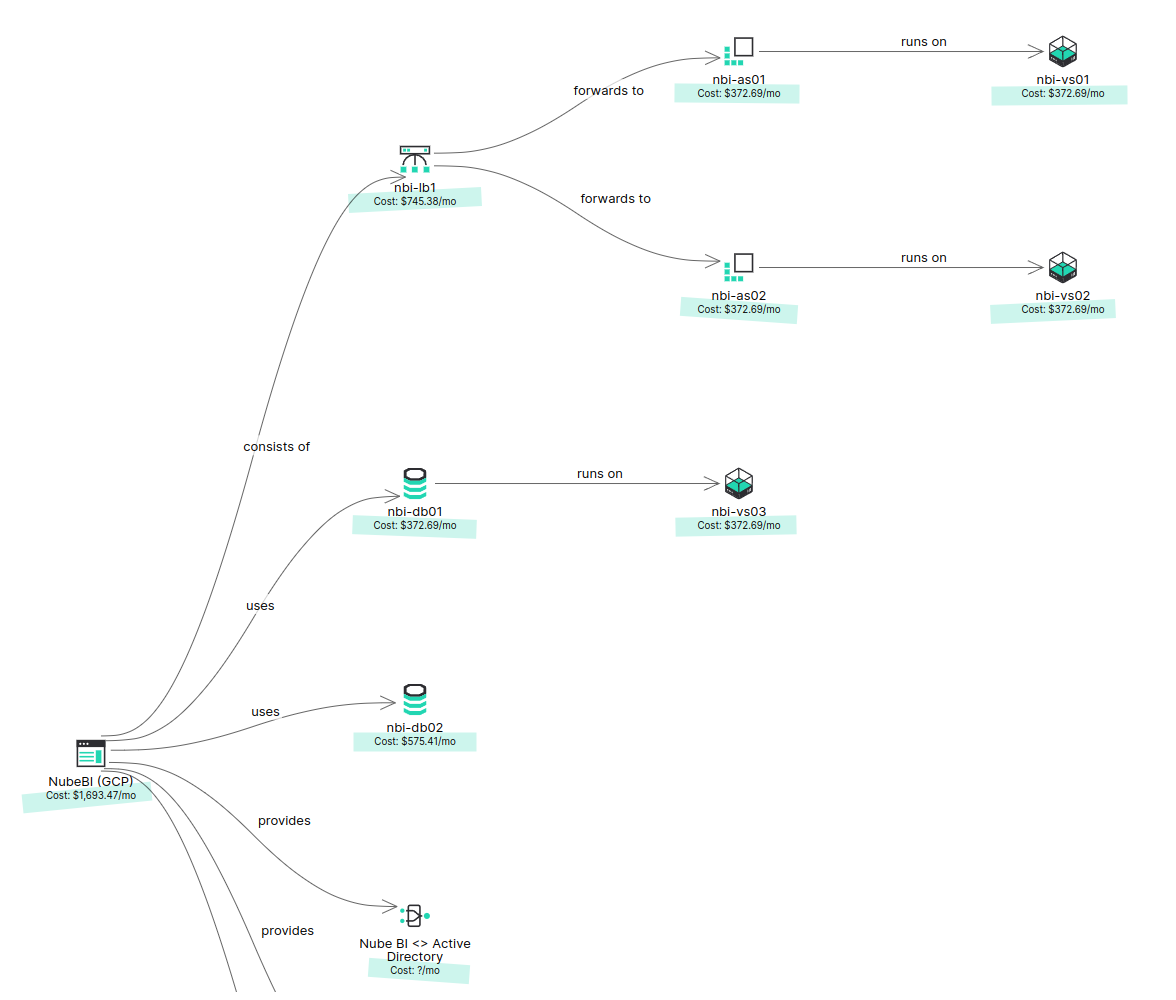 Figure 3. Cost distribution and allocation of cost per application based on underlying infrastructure cost.
Visualization of historic cost and carbon performance metrics can be achieved on individual levels, e.g. across business units or per cloud product type in use.
Modernization proposals with detailed insights into the impact on cost
Additionally Txture simulates optimizations and infrastructure modernization in the cloud and shows these outcomes side by side with the current state of your application portfolio.
This greatly helps to identify candidate applications for a cloud transformation and from there automates target architecture proposals to guide transformation execution (see the user flow for architects and application owners in Figures 4 to 6).
 Figure 4. Overview of cloud transformation strategies across the application portfolio and their impact regarding cost and carbon
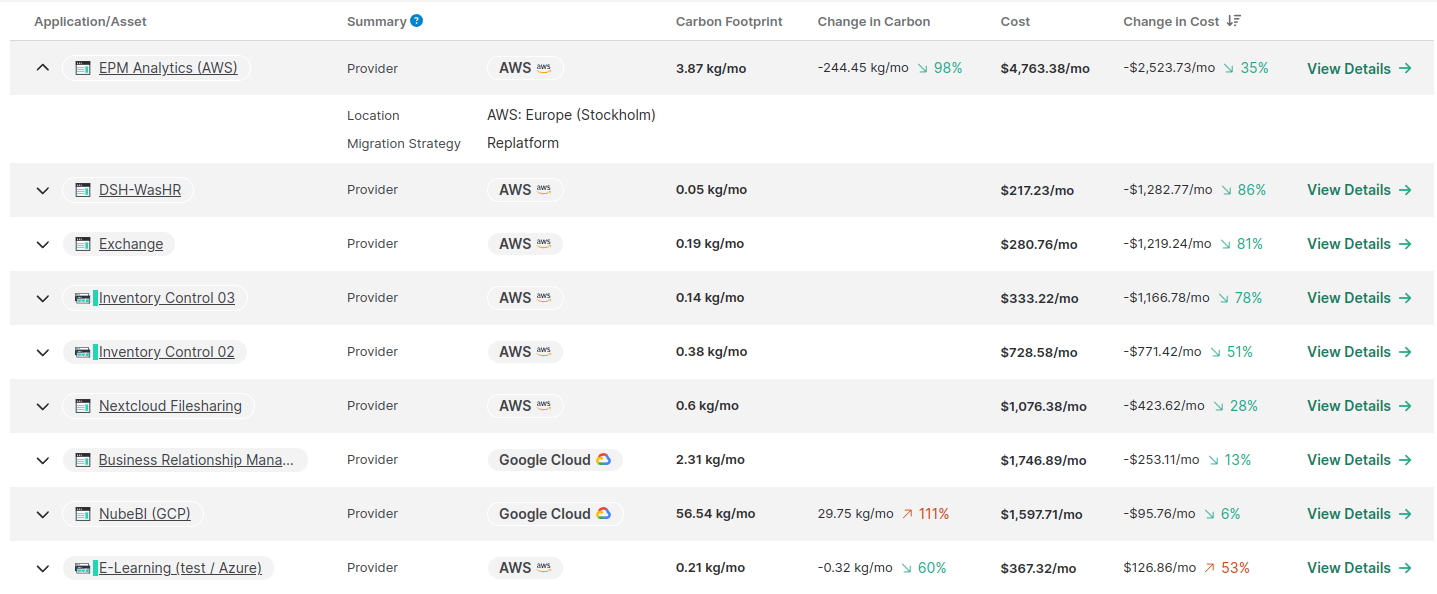 Figure 5. Per application view on impacts of applying a containerization strategy.
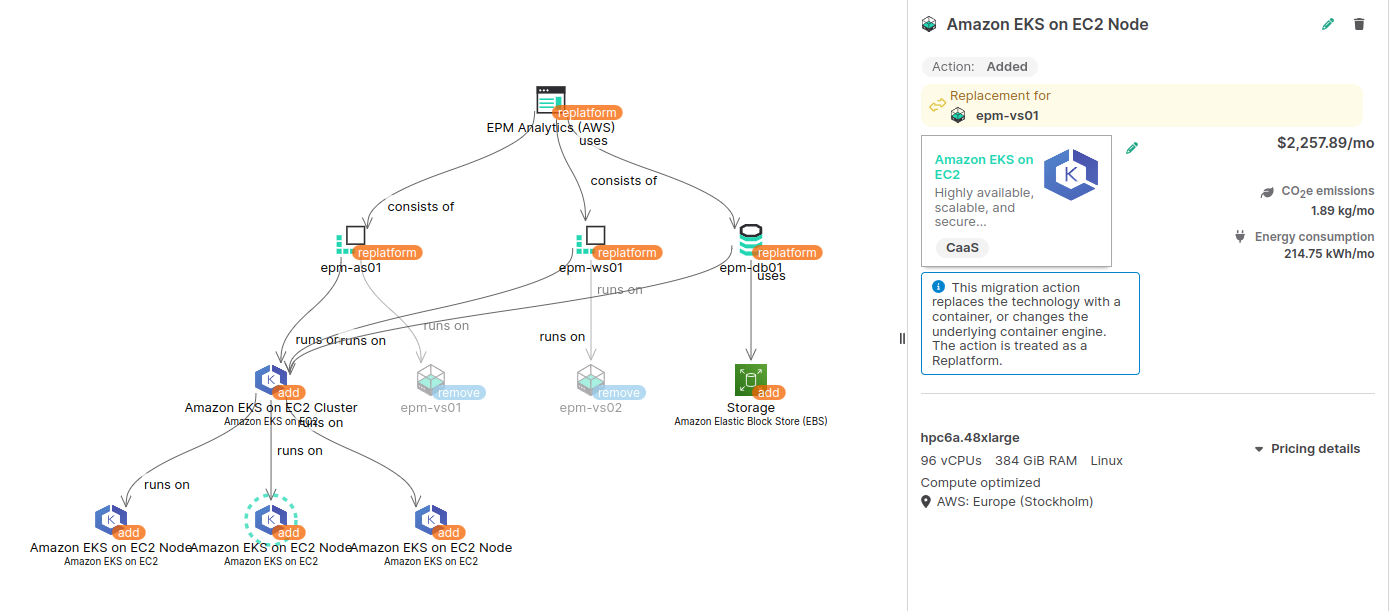 Figure 6. Per application detailed cloud target architecture proposition, in this case leveraging Kubernetes products of a client's strategic cloud service provider AWS.
With this new release, organizations, whatever their size, can now get started with FinOps. Txture delivers a swift and comprehensive overview of your existing application portfolio. With intelligent recommendations, it highlights immediate cost-saving opportunities and strategies to minimize your cloud's carbon footprint. Moreover, it provides detailed guidance and proposals for modernizing critical applications, ensuring your cloud portfolio delivers maximum value to your business.
Ready to optimize your cloud portfolio from Day 1 with the Txture platform?
Reach out to us and let's discuss your current FinOps and GreenOps initiatives!
Your feedback to our latest features!
Want to learn more about the Txture platform? Reach out to us, we'll be happy to help!