Historical analysis of change during a Cloud Journey

One of Txture Cloud Transformation's (CT) fundamental platform features is its native ability to track changes over time of an evolving as-is business, application and IT-architecture landscape. This is crucial especially considering the following:
- In the time span migration planning takes place, an as-is IT landscape does not stand still, but changes due to a regular maintenance and modernization lifecycle.
- Cloud migration inherently leads to adjustments of the as-is IT landscape while it gets transformed into the planned cloud target architecture.
There are different approaches in Txture CT to learn about changes and e.g. adjust already drafted migration plans of impacted application stacks. A new way in Txture CT to display and compare change is the "Aggregations over time" reporting type found in the reporting section:

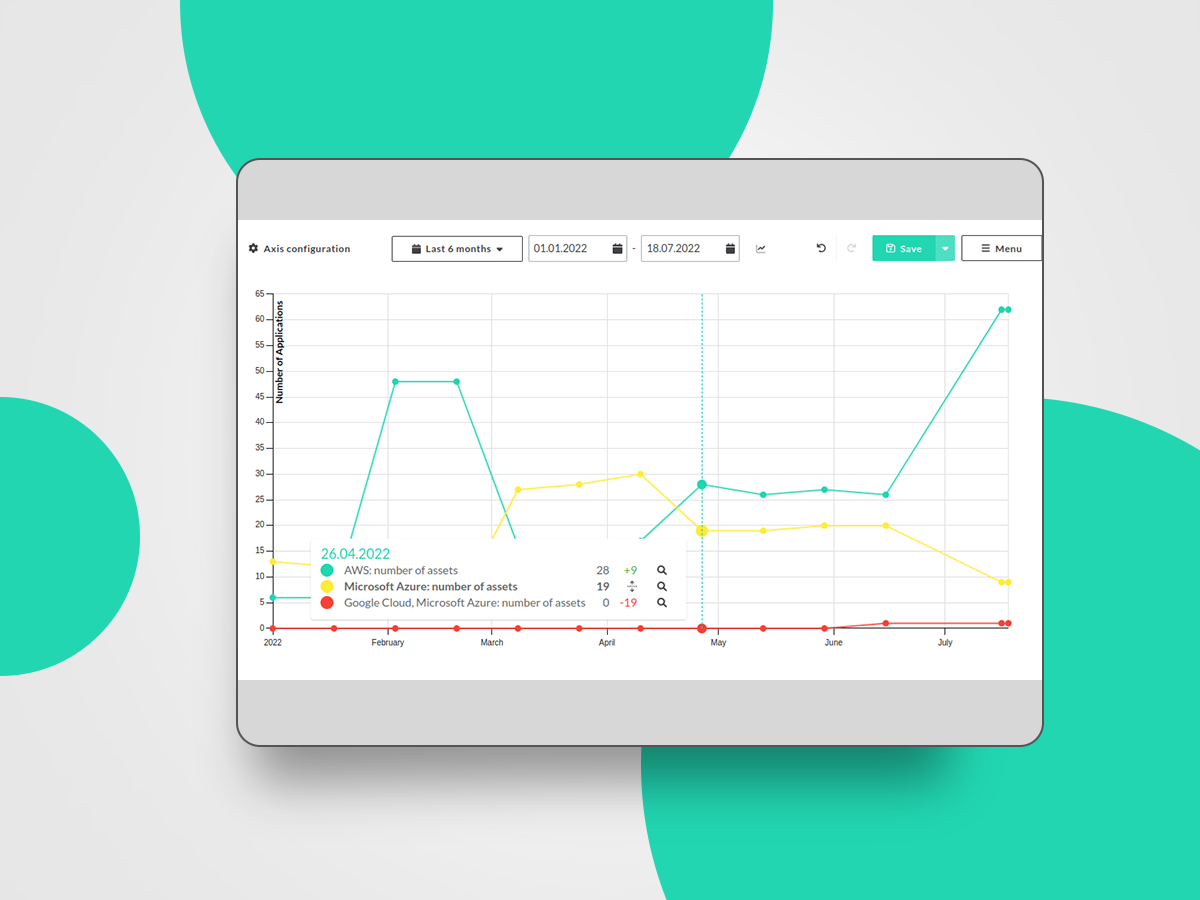
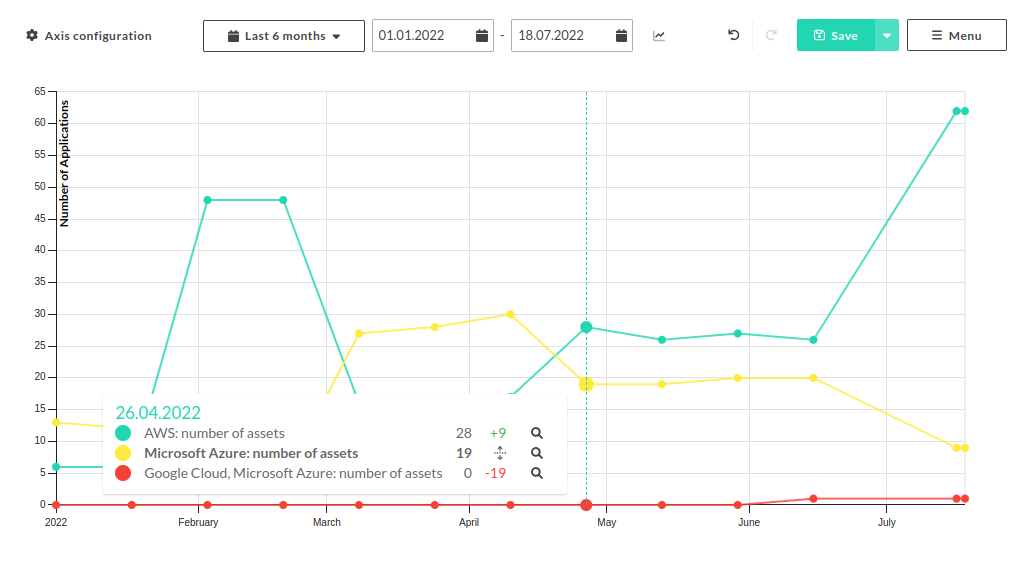
To give you an example, the following report visualizes the distribution of applications as they get assigned to target cloud service providers (CSP) during the migration planning phase. The analysis in this particular example (see Figure 1) shows how discussions e.g. involving end-client application owners shifted decisions favoring certain CSPs.
 Figure 1. Business application assets per CSP over time
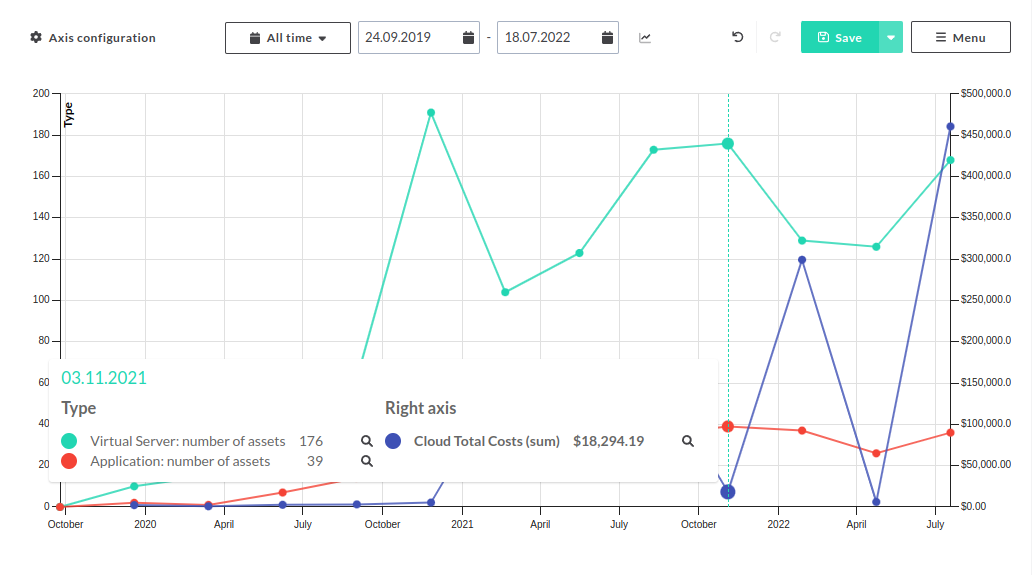
Another example below shows the number of business applications that were successfully migrated over the course of more than two years. The report (see Figure 2) provides a perspective to correlate it with the number of cloud-operated compute servers and total cloud spend per month. It e.g. shows changes in the monthly cost forecasts as the number of servers changed and likely also its sizing configurations.
 Figure 2. Correlation over time of Virtual Server and Application Assets with Cloud Total Costs
Historical analysis of statistical and aggregated data is a very powerful tool. Leverage it to gain valuable insights and draw conclusions in all phases of a cloud journey, whether you are currently performing early stage data collection and cloud assessments or later stage migration execution. We are certain that this functionality will support both your internal and client-related reporting.
Want to see Txture in action?
Feel free to request a demo or contact us for more information!