New Reports to Speed up Cloud Migration Decisions

There is an old saying that "good preparation is half the battle". A thorough analysis of the existing application landscape supports all subsequent phases of transformation planning - from the assessment to the actual planning of the migration waves.
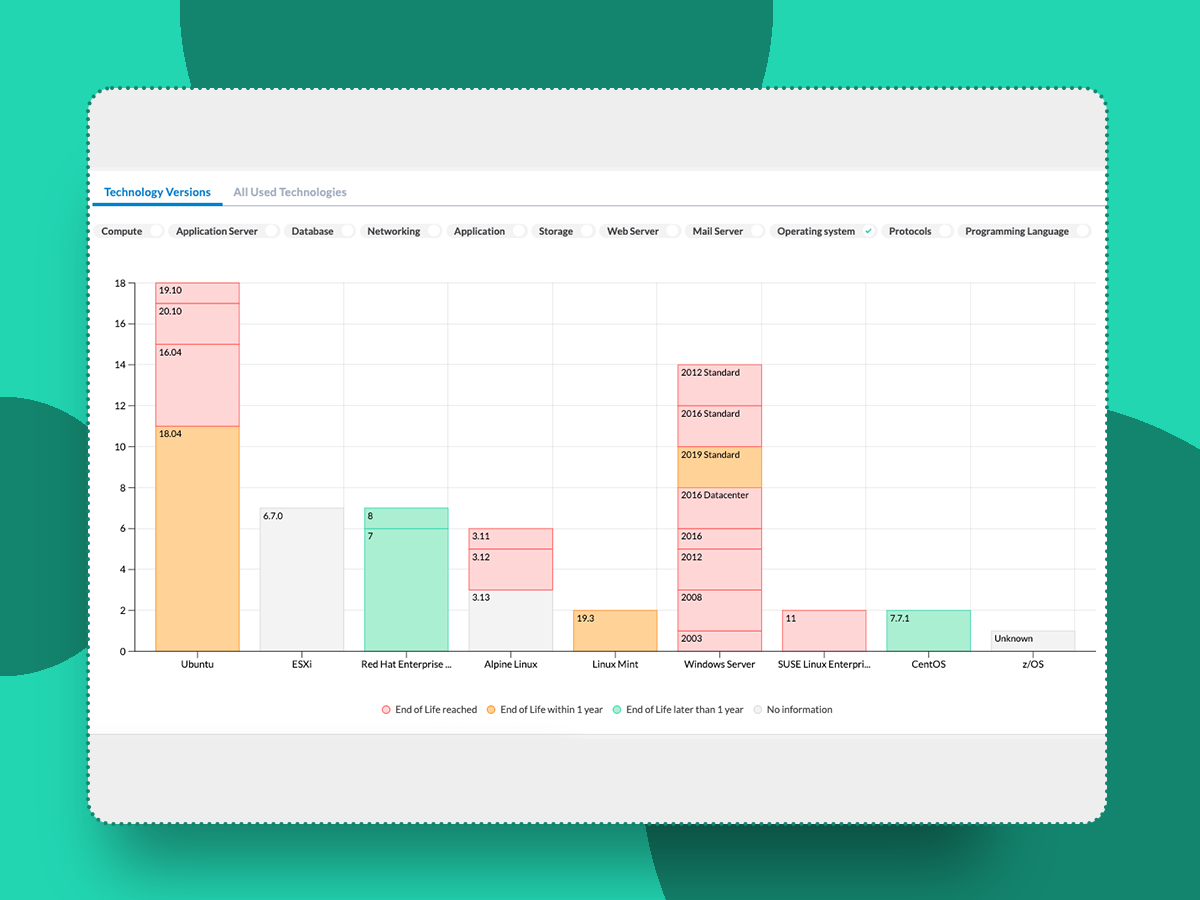
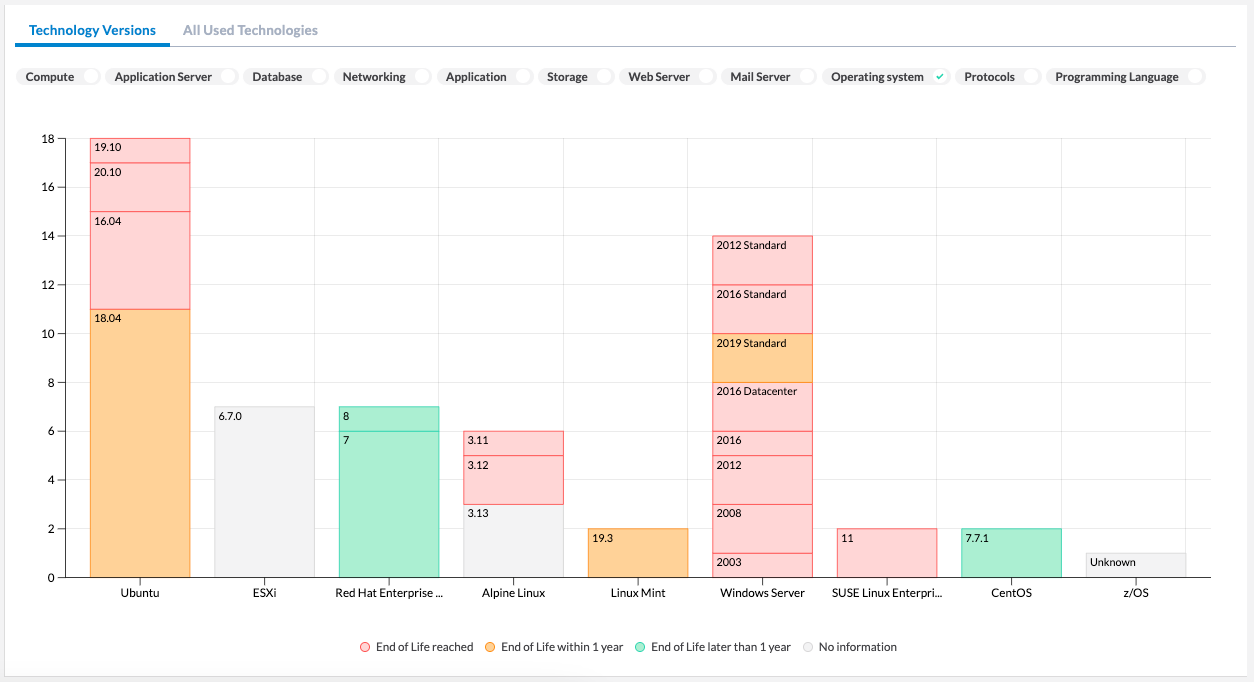
 Figure 1: Server Operating System versions with indication on their End of Life date.
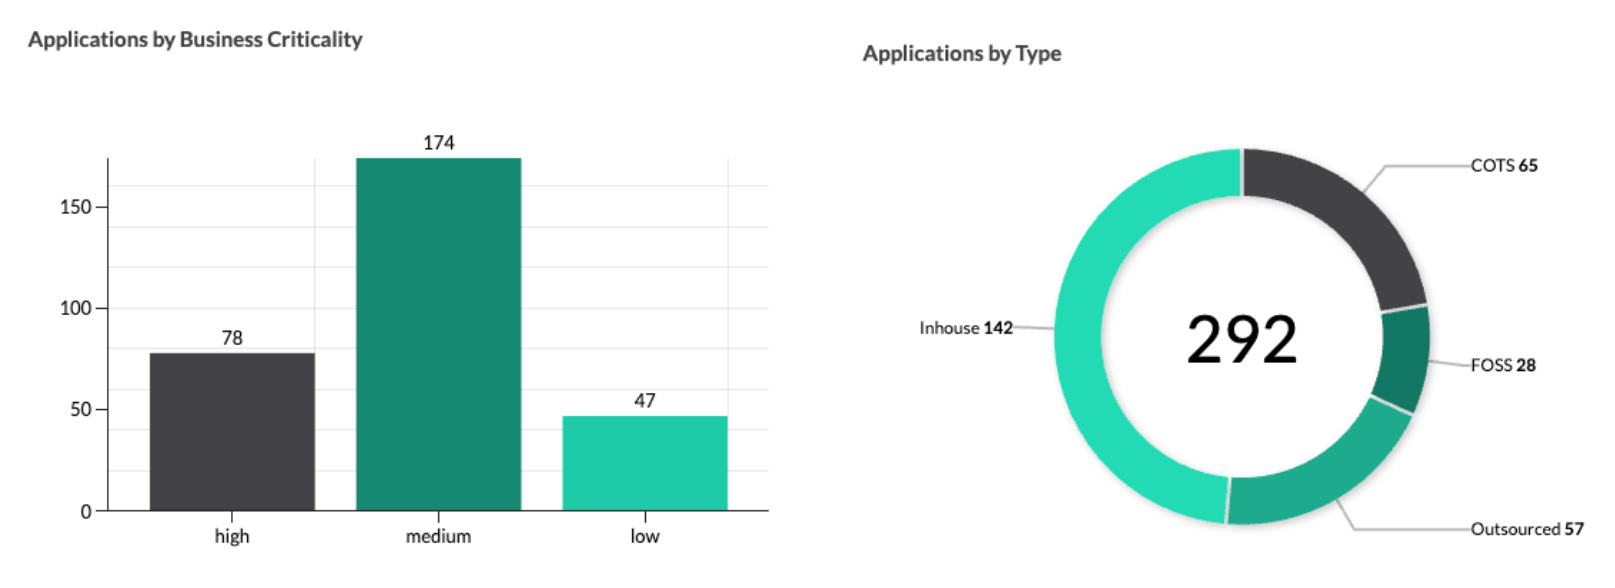
Additional standardized reports are now available in Txture and are aimed to support you in the analysis and decision-making process. For instance, end of life reports on different technology versions (Figure 1) give you and your clients a better understanding of how outdated the application landscape is which often serves as an additional indicator for the overall migration effort. Other reports about shared technical components, ownership or business criticality (Figure 2 & 3) may serve as discussion ground in the assessment to decide on cloud move candidates in general. Even after detailed planning of the target architecture, these application portfolio insights can help categorize specific applications into specific move groups or migration waves. The new standard reports are based on a new chart type, the so-called Stacked Bar Charts which we made also available for your custom report section. Use this report type to show comparisons between categories of data while also allowing to break down and compare parts of larger context.
 Figure 2 & 3 : Reporting on application portfolio details
With these ready-made reports at your fingertips and additional custom reporting capabilities, we hope you find yourself spending less and less time analyzing your applications in detail while gaining deeper insights.
Seeing is believing! Feel free to request a demo or contact us for more information!