What’s New in Version 27?

Txture release 27 is now available!
This time we worked hard to improve the management of cloud proposals in the Transformation Cockpit. Furthermore, we enhanced our dashboards a lot and added a monitoring section to the admin panel that gives relevant information about the instance's health state.
Read on to learn more about it!
Comments & History for saved Cloud Proposals
Over the course of our latest cloud transformation project engagements, detailed analysis of proposals for the planned cloud target architecture got increasingly important for our customers using the Transformation Cockpit. The increased use of our powerful cloud proposal features has brought to light several new requirements. Some of them have already been tackled in version 26, such as the ability to save auto-generated but also custom proposals. However, the challenge for the user to better understand why a specific architecture had been selected and if manual adjustments to the original proposal had been made remained.
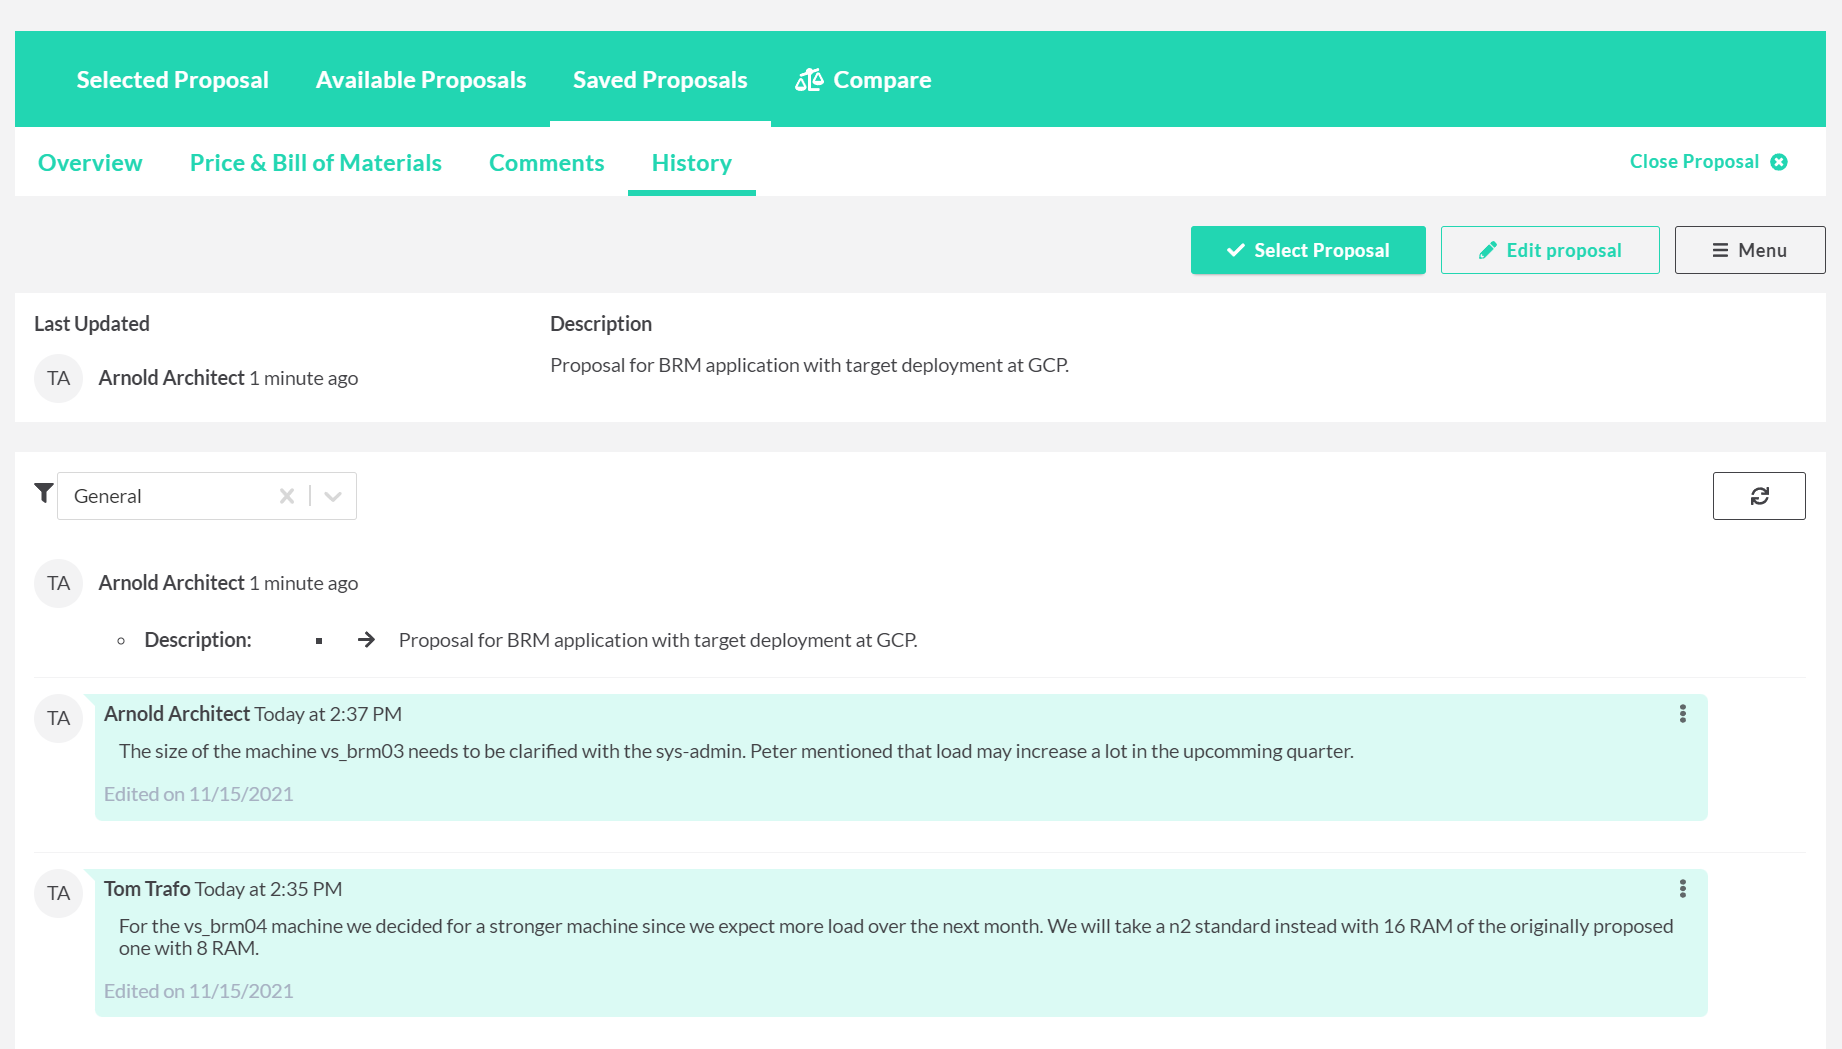
To make it clearer why a certain decision was made, we revised the proposal menu and added the Comments and History tab to the Saved Proposals menu. This allows the users to document their decisions for a proposal, write down hints for other users or upload files for further explanations. Furthermore, the user can see in the History tab if a proposal has recently changed. All in all saved proposals are now much better suited to track the solution and decision activities that are part of application target architecture planning.
 New comments and history section for saved proposals
Extended comparability of Cloud Proposals
Another great feature to identify the optimal solution for the target architecture of an application is the cloud proposal comparison view. So far, Txture has allowed us to compare different automatically generated proposals from the “Available Proposals” view. So far, we have not been able to compare automatically generated proposals with manually extended ones or those completely modeled from scratch.
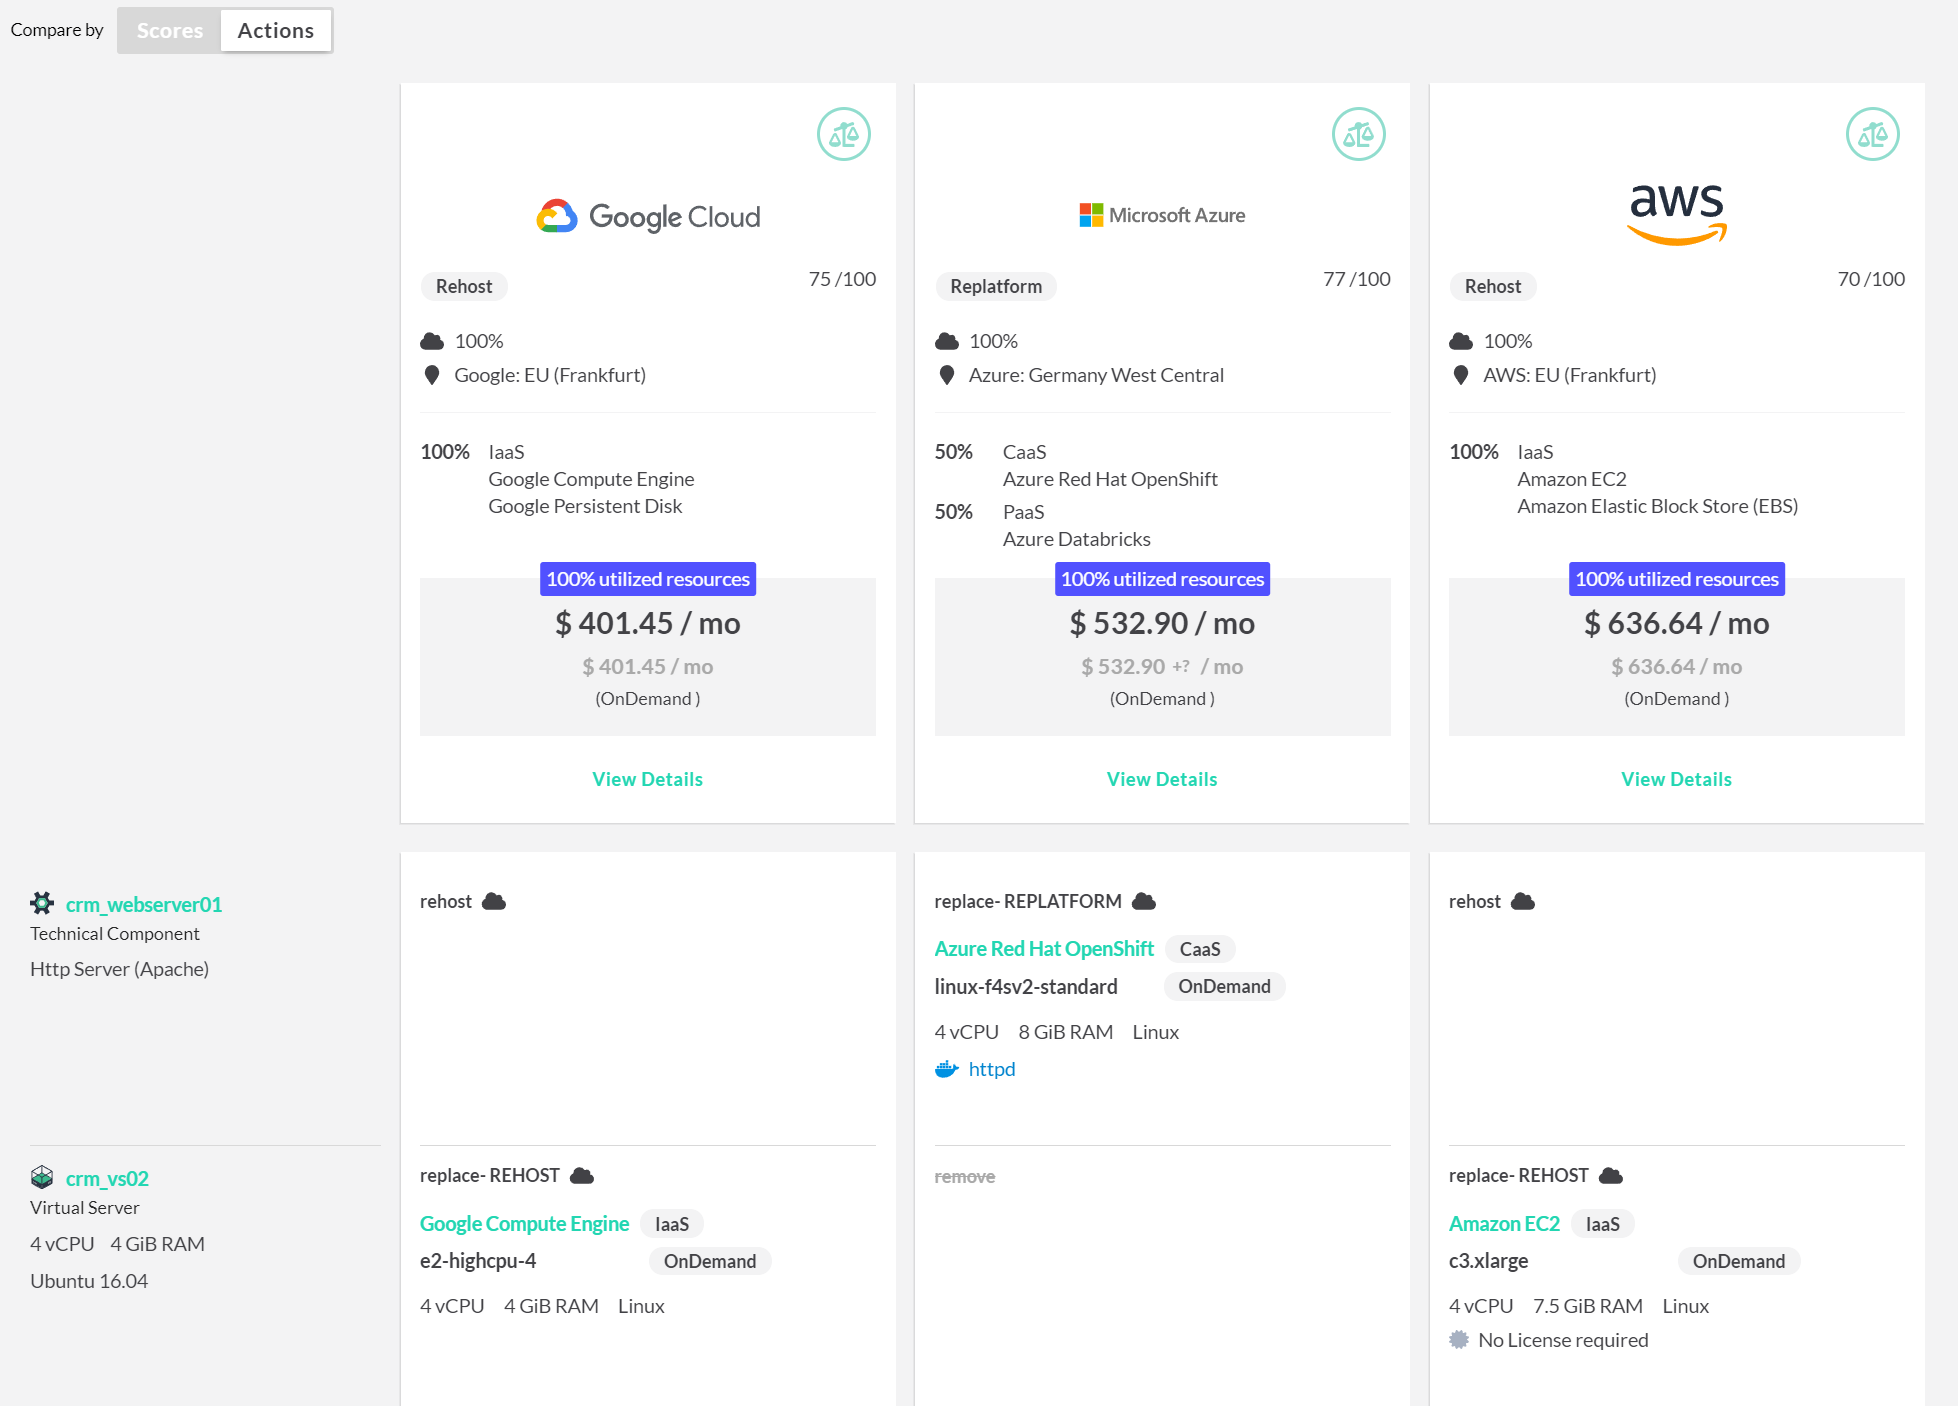
The newly enhanced cloud proposal comparison view in version 27 is the proper solution to evaluate all saved application cloud solutions side by side. This includes both aggregated cost and leveraged services, but also detailed line by line perspectives on bill of materials. Additionally migration actions can now also be compared across different proposals. This makes it easier to compare what happens to the individual components in the respective proposals and is an indicator for expected migration effort.
 Enhanced cloud proposal comparison with detailed line-by-line bill of materials
Supporting virtual cost and cluster utilization
Taking into account the costs of a compute or database cluster can be challenging when simulating cloud target architectures. The typically high costs of cluster instances must be allocated proportionally to achieve cost truth on an application level. So far, the user had to take this into account himself - that changes with Release 27.
To display proportional costs in Txture, we have introduced virtual costs as a new concept. The virtual cost is a ratio of the total costs based on resource utilization. This utilization is calculated by summing up the RAM and CPU of all application components running on the cluster, taking the percentage of the available cluster resources. This is useful to indicate how well the resources of cloud cluster instances like for VMware on Cloud are leveraged across the dependent applications.
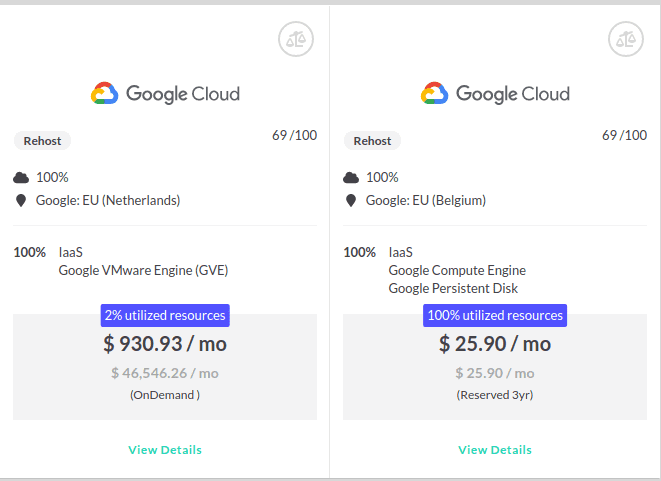
The screenshot below shows an example of a Google VMware Engine that is taken into consideration for calculating the cost of one of the applications and their components hosted on this cluster. The components that can be assigned to the application in scope only consume 2 percent of the cluster’s resources. Accordingly, only 2 percent of the total costs were passed on to the application. The cost per month shows the comparable virtual cost, whereas the light gray number below shows the actual total cost.
 Example of the automatic calculation of the proportional costs of a compute cluster
This newly featured comparability helps to determine whether moving to individual VMs or a cloud-based compute cluster is more meaningful, at least from an operational cost perspective. Bear in mind that technology preferences, migration effort, and hybrid cloud effects need to be considered additionally.
What’s more?
In addition to the new features explained above, we have also worked on other areas of the software and expanded a few things:
-
Powerful new coloring settings for conditional styling
The new color setting enables color gradients based on property values. -
Asset timeline restore
The status of an asset can now be reset to an earlier point in time directly in the sidebar in the timeline menu. -
Rescoring Cloud Proposals
Fulfillments of target architecture preferences can now be scored also for manually adjusted proposals using the “rescore proposal” feature. -
Template Dashboards
Template variables can now also be used in dashboards to enable e.g. flexible fact sheets. This makes reporting with Txture’s dashboards even more powerful. The dashboard selector has also been given a new styling. -
Health monitoring for admin
We added a new section to the admin panel that gives the admin relevant information about the instance's health state. -
New indexing format for the Txture database
Secondary indices can now be defined on properties to improve query and reporting speed. -
Improved reporting capabilities
We improved donut chart labels and now support the vertical mode for tree reports.
Are your fingers tingling? That’s the urge to try out our new version.
Feel free to request a free demo or contact us for more information!
