Reporting on cost distribution of planned cloud transformations

Cost is always a driving factor when deciding if and how to move forward in a cloud transformation. Txture allows to lay out cloud target solution architectures by taking into account different routes that all come with varying benefits. Degree of scalability, expected maintenance efforts, improving development/deployment cycles, and such are typical benefits considered, but so is the associated cost of a cloud solution.
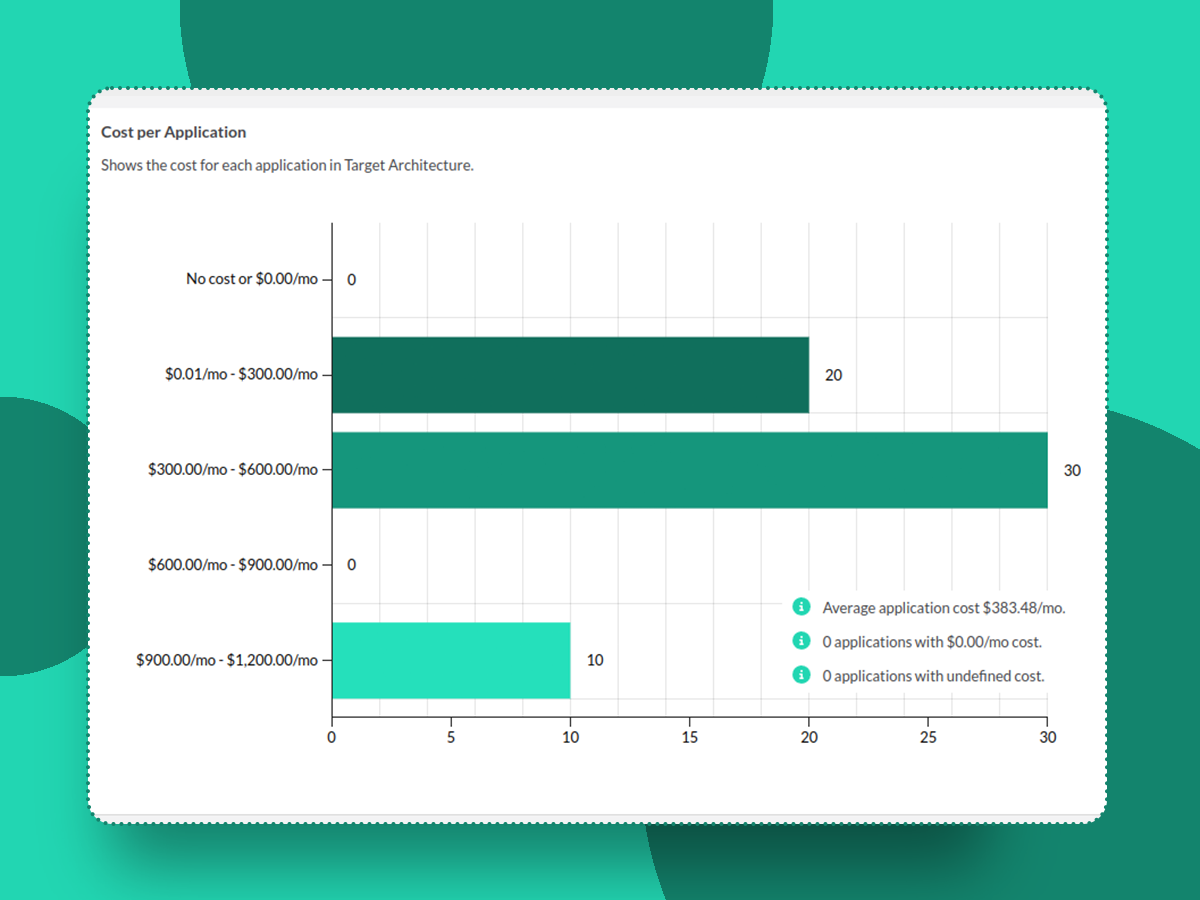
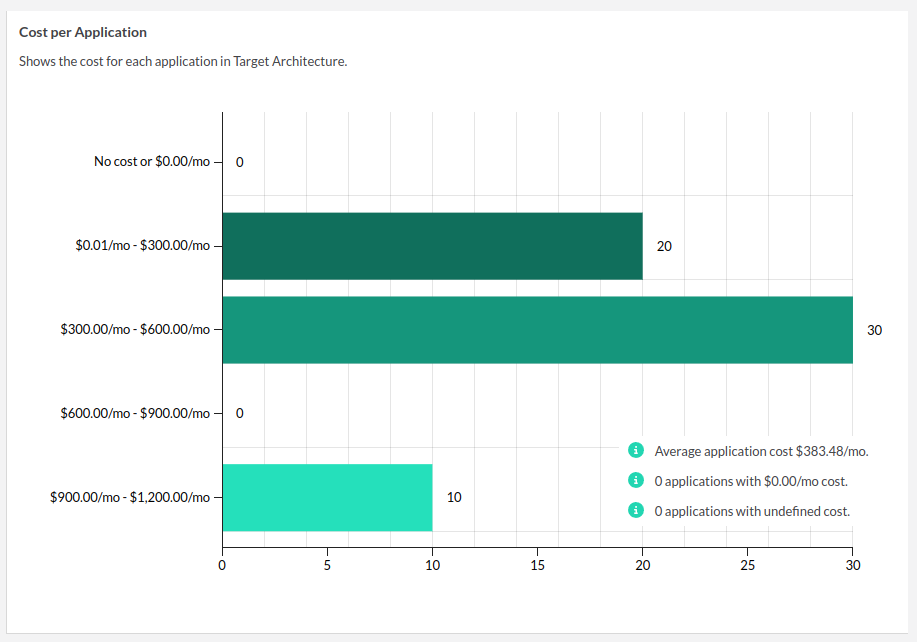
In order to plan cloud migrations and get a flexible cost perspective, Txture has now introduced a combined cloud cost distribution chart.
 This chart gives you clear insights into the costs associated with each of your applications, as well as right-sizing opportunities.
Using Txture's baked in query capabilities you can leverage this chart nicely to see
- future cost allocation of soon-to-be-migrated applications of a specific migration wave,
- required budgets across business units to make a cloud move happen for their application portfolio,
- applications with high cost optimization potentials
- associated cost of application set to be migrated in specific regions
- and much more.
It also shows you average cloud application cost for your cost perspective of interest and highlights applications with no associated cost, indicating the use of cloud services where pricing parameters might be missing, hindering a price computation.
Txture's combined cloud cost distribution chart is also a great means of reporting for cloud consultants, stakeholders of cloud competence centers and decision makers to gain the needed cost transparency for their cloud transformation initiatives.
We are certain that this new reporting capability will come in very handy in your upcoming cloud endeavors.
Check it out and get in touch to learn more!
Feel free to request a free demo or contact us for more information