Introducing solution workbench for cloud target architectures

In close collaboration with our partners we’ve been working on enhancing our capabilities to create comprehensible cloud solution architecture diagrams. Those diagrams represent all structural aspects of a cloud solution by visualizing cloud services and service configuration of an application as well as cloud service dependencies.
On the one hand, users will save time when creating detailed cloud solution architecture diagrams for clients or internal reporting. On the other hand, this will also improve the handover process between different teams, for instance, between the assessment team and actual migration teams that are in need of detailed solution architectures.
What can you do with the Solution Workbench?
Txture is already capable of automatically creating solution architecture visualizations based on cloud proposals. With the latest improvements, we focused on improving the general usability to manually model starting from scratch or based on the auto generated solution architectures.
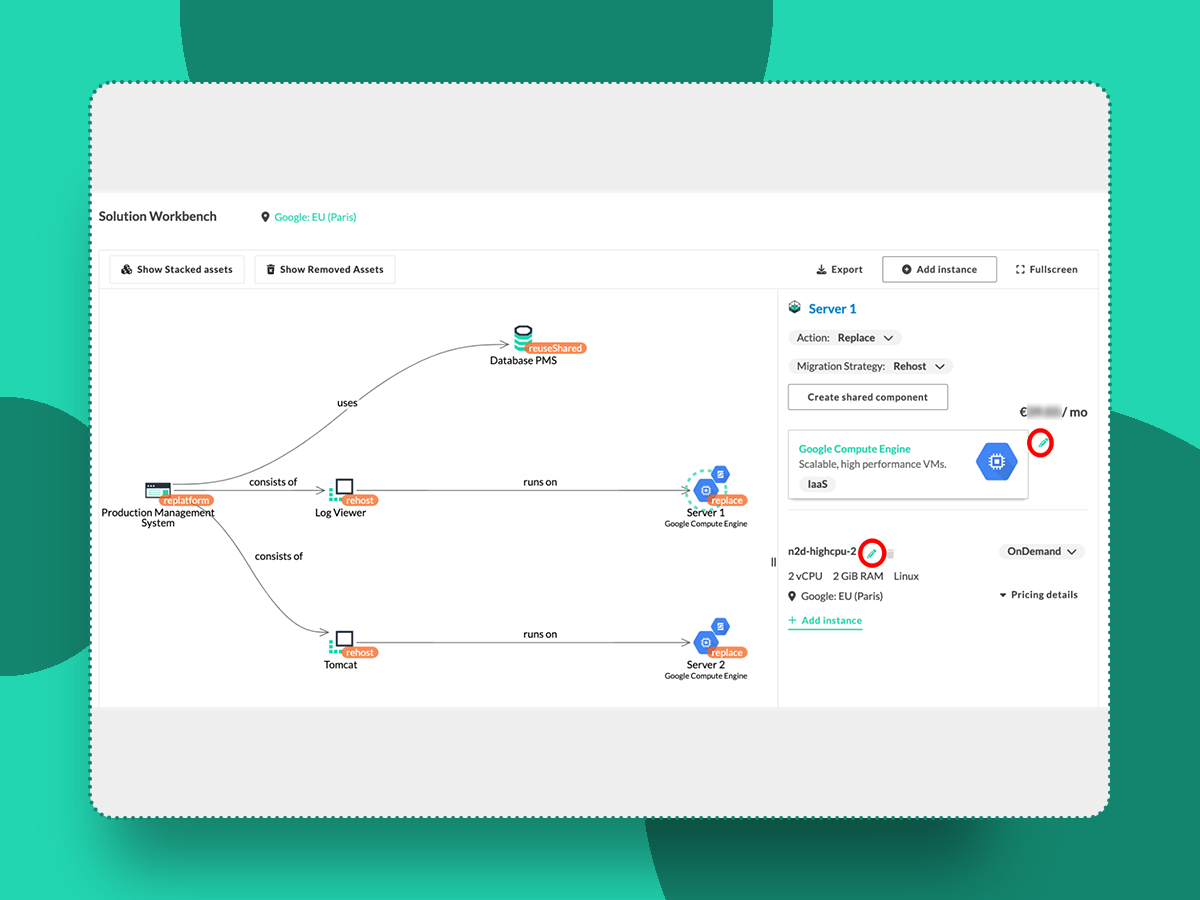
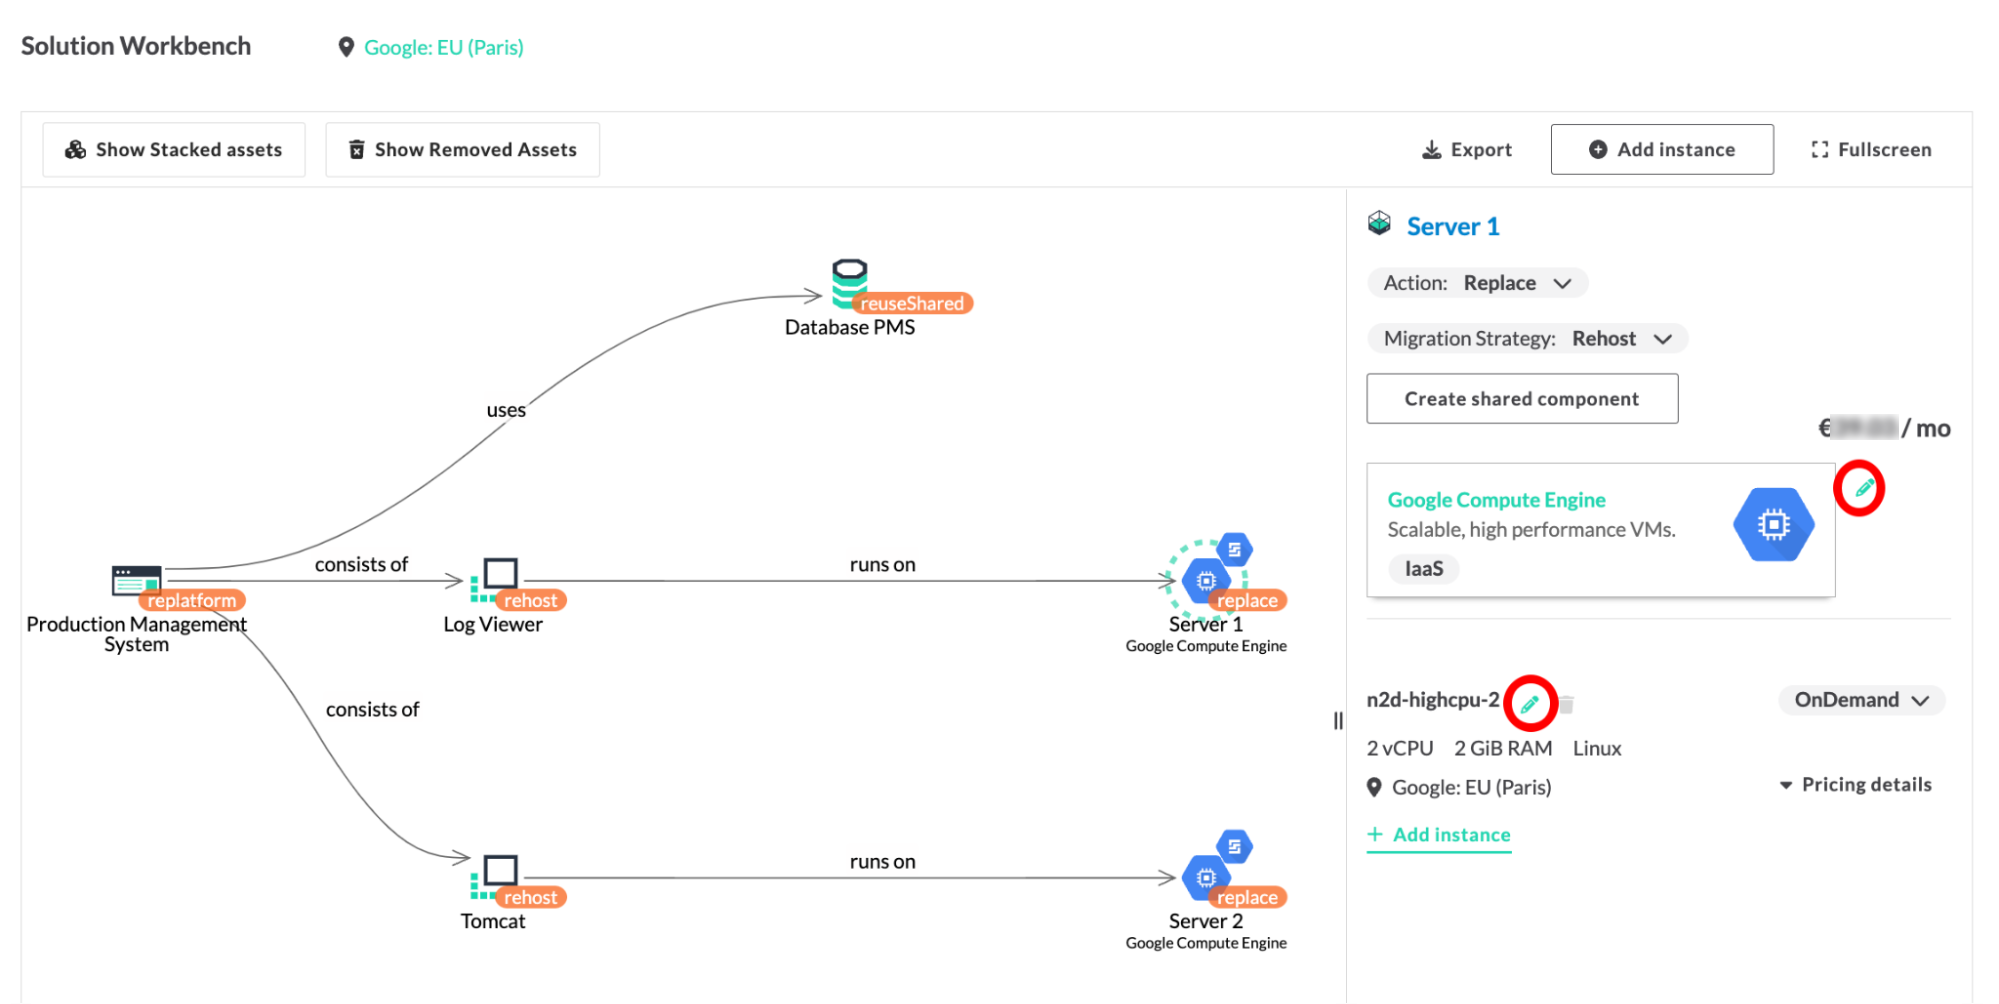
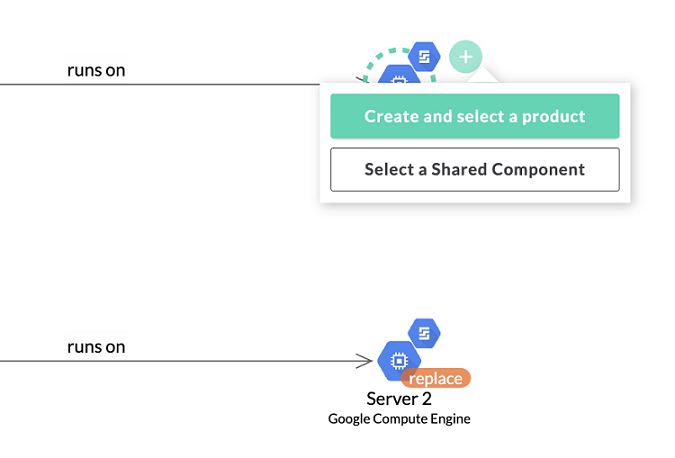
Beginning with version 37, the solution architecture graph for each proposal is displayed in a dedicated area called the Solution Workbench. This view now provides more space to perform actions such as, changing product instances conveniently from the new sidebar (figure 1) or creating additional links to missing deployment components directly from a selected node in the diagram (figure 2).
 Figure 1: Solution Workbench with change actions in the sidebar.
 Figure 2: Creating additional links to missing deployment components directly from a node in the graph.
Additionally, we simplified the diagram to make large and complex architectures more comprehensible. There is now the option to hide or show components that are going to be removed when moving to the cloud. Storage elements related to compute infrastructure are grouped for more compact visualizations.
And more interactive, as well as automatic modeling options are yet to come!
Your feedback to our new feature
Let us know if you want to learn more about Txture's cloud assessment capabilities and roadmap.