Useful reporting enhancements in the transformation cockpit to win your client trust
Txture drives application assessments and cloud migration planning in a very efficient and standardized manner to make your consulting teams perform even better with your client. It provides a range of insights e.g. into the current state business application portfolio, dependencies, IT technology situation, organization and processes and much more. A great value-add is that Txture automates many steps towards a cloud target state for the client's entire application portfolio.
Analyzing the current state of a client's application portfolio, and agreeing on cloud migration decisions are constant activities for the cloud consulting team. Beyond that, your clients also want to understand your progression in a migration plan, hence reporting is a critical element to be successful and become a trusted part in a cloud migration deal. But in the context of large-scale migration projects, providing clear, up-to-date reports to your consulting team and your client can be pretty challenging.
Txture has always been great to help consulting teams understand the client situation in order to become quickly knowledgeable and deeply involved. For the upcoming release we have prepared new helpful reporting additions that help you better understand the size and complexity of an upcoming cloud migration.
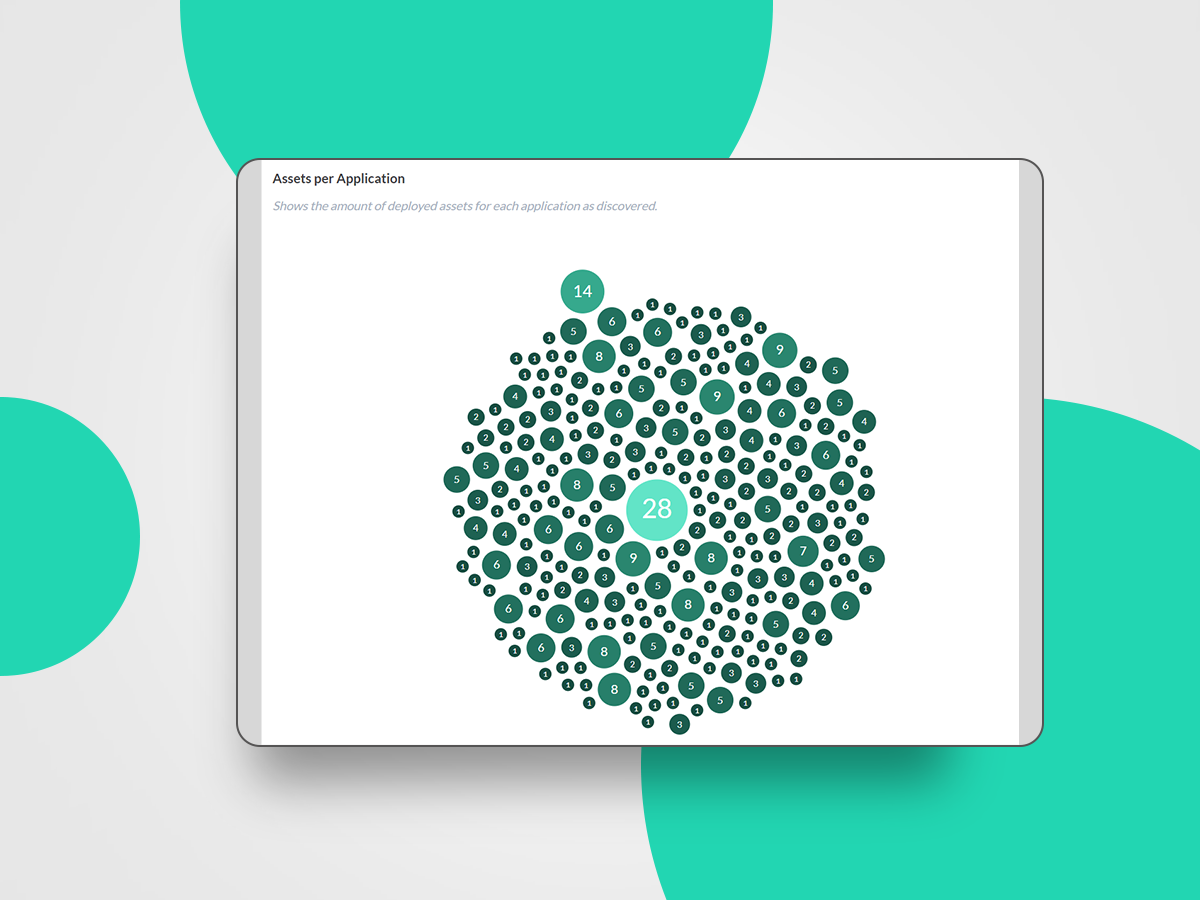
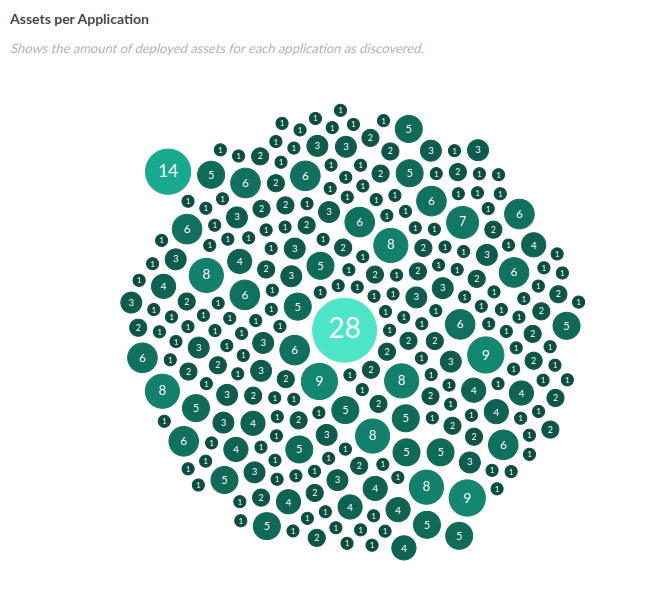 Application stack size chart showing numbers of IT assets associated with all applications
The application stack size chart helps you understand application sizes and size distribution. It considers both technical components and associated IT infrastructure assets which is a basic, but nevertheless important indicator of the size of a migration project.
Specifically the application stack size charts helps to draw attention e.g. to applications that are specifically large and may require thorough validation. It can also help to define a set of small or average standard applications that may be a good starting point for a transformation. For sure, other factors like business impact, data risk and cloud suitability need to be considered on top. But it helps to set a ground for assessment and discussion with the client.
The same report is also available to visualize a planned cloud target state application portfolio for the very same reasons. There it considers application stack sizes of cloud target application architectures that were generated automatically by Txture or where manually solution modeling has been applied.
Another important factor to estimate migration efforts is to understand the amount of outdated IT technologies that you have to deal with at a particular client. To make your life easy we have added an end-of-life/end-of-support view option as a default in the technology overview chart. As you see in the example below, sorting by usage count helps you understand which share of technologies are candidates for an upgrade or phase-out. Different coloring indicates whether a technology is already outdated (cf. items colored in red) or soon will be (cf. items colored orange).
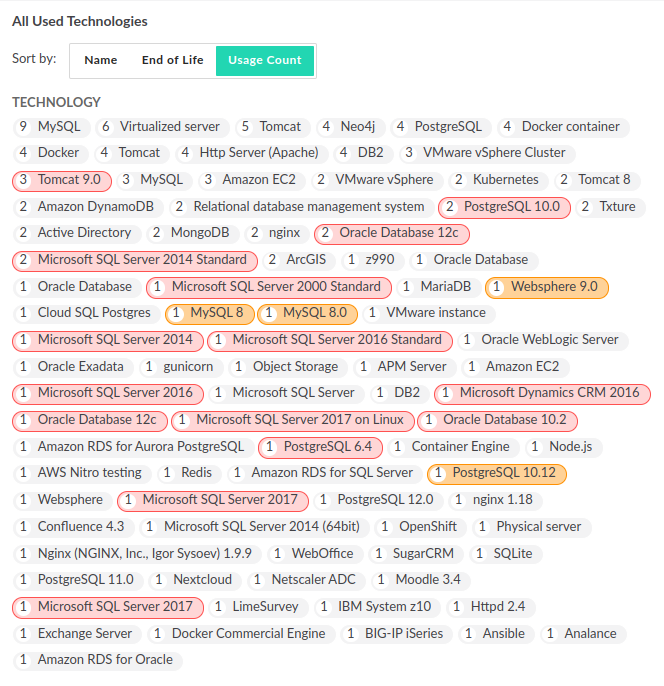 Collected application technologies indicated by usage via sort order and end-of-life/end-of-support via color.
We will continue to strive for ultimate support of consulting and cloud delivery teams to be successful in all of their cloud engagements. Choose Txture to get the best support for your teams during cloud transformation projects.
Thanks to a strong, standardized process and extended reporting capabilities, Txture helps you speed up your cloud transformation projects!
Feel free to request a free demo or contact us for more information